Monitoring and Tracing
Monitoring and tracing are essential for debugging and understanding the performance and overall behavior of your Hive Gateway.
If something is not working as it should within your GraphQL gateway, you would not want it to go unnoticed.
Monitoring and tracing are essential for debugging and understanding the performance of your gateway.
You can use Gateway plugins to trace and monitor your gateway’s execution flow together with all outgoing HTTP calls and internal query planning.
Healthcheck
Hive Gateway is aware of the usefulness of a health check and gives the user maximum possibilities to use the built-in check.
There are two types of health checks: liveliness and readiness, they both are a health check but convey a different meaning:
- Liveliness checks whether the service is alive and running
- Readiness checks whether the upstream services are ready to perform work and execute GraphQL operations
The difference is that a service can be live but not ready - for example, server has started and is accepting requests (alive), but the read replica it uses is still unavailable (not ready).
Both endpoints are enabled by default.
Liveliness
By default, you can check whether the gateway is alive by issuing a request to the /healthcheck
endpoint and expecting the response 200 OK. A successful response is just 200 OK without a body.
You can change this endpoint through the healthCheckEndpoint option:
Readiness
For readiness check, Hive Gateway offers another endpoint (/readiness) which checks whether the
services powering your gateway are ready to perform work. It returns 200 OK if all the services
are ready to execute GraphQL operations.
It returns 200 OK if all the services are ready to perform work.
You can customize the readiness check endpoint through the readinessCheckEndpoint option:
OpenTelemetry Traces
Hive Gateway supports OpenTelemetry for tracing and monitoring your gateway.
To send traces directly to Hive Console, follow the OpenTelemetry integration guide.
OpenTelemetry is a set of APIs, libraries, agents, and instrumentation to provide observability to your applications.
The following are available to use with this plugin:
- HTTP request: tracks the incoming HTTP request and the outgoing HTTP response
- GraphQL Lifecycle tracing: tracks the GraphQL execution lifecycle (parse, validate and execution).
- Upstream HTTP calls: tracks the outgoing HTTP requests made by the GraphQL execution.
- Context propagation: propagates the trace context between the incoming HTTP request and the outgoing HTTP requests.
- Custom Span and attributes: Add your own business spans and attributes from your own plugin.
- Logs and Traces correlation: Rely on standard OTEL shared context to correlate logs and traces
OpenTelemetry Setup
For the OpenTelemetry tracing feature to work, OpenTelemetry JS API must be setup.
We recommend to place your OpenTelemetry setup in a telemetry.ts file that will be your first
import in your gateway.config.ts file. This allow instrumentations to be registered (if any)
before any other packages are imported.
For ease of configuration, we provide a openTelemetrySetup function, with sensible default and
straightforward API compatible with all runtimes.
But this utility is not mandatory, you can use any setup relevant to your specific use case and infrastructure.
The most commonly used otel packages are available when using Hive Gateway with CLI. Please switch to programmatic usage if you need more packages.
Please refer to opentelemetry-js documentation for
more details about OpenTelemetry setup and API.
Basic usage
This configuration API still rely on official @opentelemetry/api package, which means you can use
any official or standard compliant packages with it.
You will have to pick a
Context Manager (we recommend
to use AsyncLocalStorageContextManager from @opentelemetry/context-async-hooks if your runtime
supports AsyncLocalStorage API), and a trace exporter depending on your traces backend (probably
@opentelemetry/exporter-trace-otlp-http).
Depending on your usage, you will have to import openTelemetrySetup from a different module:
- CLI usage:
@graphql-hive/gateway/opentelemetry/setup - Programmatic usage :
@graphql-hive/plugin-opentelemetry/setup
After configuring and setting up the telemetry, make sure to import it as the first import in your
gateway.config.ts file and enable OpenTelemetry tracing:
OpenTelemetry provides an official SDK for Node (@opentelemetry/sdk-node). This SDK offers a
standard API compatible with OTEL SDK specification. You will also need an exporter depending on
your traces backend (probably @opentelemetry/exporter-trace-otlp-http)
It ships with a lot of features, most of them being configurable via environment variables.
The most commonly used otel packages are available when using Hive Gateway with CLI, which means you
can follow official @opentelemetry/sdk-node documentation for your setup. Please switch to
programmatic usage if you need more packages.
After configuring and setting up the telemetry, make sure to import it as the first import in your
gateway.config.ts file and enable OpenTelemetry tracing:
If your use case is simple enough, you can use CLI options to setup OpenTelemetry.
By default, an HTTP OTLP exporter will be used, but you can change it with
--opentelemetry-exporter-type:
Please refer to openTelemetrySetup() usage if you need more control and options.
Service name and version
You can provide a service name, either by using standard OTEL_SERVICE_NAME and
OTEL_SERVICE_VERSION or by providing them programmatically via setup options
Custom resource attributes
Resource attributes can be defined by providing a Resource instance to the setup resource
option.
This resource will be merged with the resource created from env variables, which means
service.name and service.version are not mandatory if already provided through environment
variables.
Trace Exporter, Span Processors and Tracer Provider
Exporters are responsible of storing the traces recorded by OpenTelemetry. There is a large existing
range of exporters, Hive Gateway is compatible with any exporter using @opentelemetry/api standard
OpenTelemetry implementation.
Span Processors are responsible of processing recorded spans before they are stored. They generally take an exporter in parameter, which is used to store processed spans.
Tracer Provider is responsible of creating Tracers that will be used to record spans.
You can setup OpenTelemetry by providing either:
- a Trace Exporter. A Span processor and a Tracer Provider will be created for you, with sensible production defaults like trace batching.
- a list of Span Processors. This gives you more control, and allows to define more than one exporter. The Tracer Provider will be created for you.
- a Tracer Provider. This is the manual setup mode where nothing is created automatically. The Tracer Provider will just be registered.
OpenTelemetry’s NodeSDK doesn’t allow to manually provide a Tracer Provider. You have to register
it separately.
Hive Gateway CLI embeds every official OpenTelemetry exporters. Please switch manual deployment or programmatic usage to install a non-official exporter.
A simple exporter that writes the spans to the stdout of the process. It is mostly used for
debugging purpose.
See official documentation for more details.
An exporter that writes the spans to an OTLP-supported backend using HTTP.
An exporter that writes the spans to an OTLP-supported backend using gRPC.
Jaeger supports OTLP over HTTP/gRPC, so you can
use it by pointing the
@opentelemetry/exporter-trace-otlp-http/@opentelemetry/exporter-trace-otlp-grpc to the Jaeger
endpoint. In the following example, we are using the HTTP exporter.
Your Jaeger instance needs to have OTLP ingestion enabled, so verify that you have the
COLLECTOR_OTLP_ENABLED=true environment variable set, and that ports 4317 and 4318 are
accessible.
NewRelic supports OTLP over HTTP/gRPC, so you can use it
by configuring the
@opentelemetry/exporter-trace-otlp-http/@opentelemetry/exporter-trace-otlp-grpc to the NewRelic
endpoint. In the following example, we are using the HTTP exporter.
Please refer to the NewRelic OTLP documentation for complete documentation and to find the appropriate endpoint.
DataDog Agent supports OTLP over HTTP/gRPC,
so you can use it by pointing the @opentelemetry/exporter-trace-otlp-http to the DataDog Agent
endpoint
You can also use the official DataDog Tracer Provider by using manual Hive Gateway deployment and installing the dependency.
The official DataDog’s TracerProvider is the recommended approach, because it enable and sets up
the correlation with DataDog APM spans.
It is possible to not use DataDog Agent if you want to only use DataDog as a tracing backend.
DataDog is compatible with standard OTLP over HTTP export format.
It is possible to not use DataDog Agent if you want to only use DataDog as a tracing backend.
DataDog is compatible with standard OTLP over HTTP export format.
Zipkin is using a custom protocol to send the spans, so you can use the Zipkin exporter to send the spans to a Zipkin backend.
Context Propagation
By default, Hive Gateway will propagate the trace context between the incoming HTTP request and the outgoing HTTP requests using standard Baggage and Trace Context propagators.
You can configure the list of propagators that will be used. All official propagators are bundled with Hive Gateway CLI. To use other non-official propagators, please switch to manual deployment.
You will also have to pick a Context Manager. It will be responsible to keep track of the current
OpenTelemetry Context at any point of program. We recommend using the official
AsyncLocalStorageContextManager from @opentelemetry/context-async-hooks when AsyncLocalStorage
API is available. In other cases, you can either try @opentelemetry/context-zone, or pass null
to not use any context manager.
If no Context Manager compatible with async is registered, automatic parenting of custom spans will
not work. You will have to retrieve the current OpenTelemetry context from the GraphQL context, or
from the getActiveContext method of the plugin instance.
Span Batching
By default, if you provide only a Trace Exporter, it will be wrapped into a BatchSpanProcessor to
batch spans together and reduce the number of request to you backend.
This is an important feature for a real world production environment, and you can configure its behavior to exactly suites your infrastructure limits.
By default, the batch processor will send the spans every 5 seconds or when the buffer is full.
The following configuration are allowed:
true(default): enables batching and useBatchSpanProcessordefault config.object: enables batching and useBatchSpanProcessorwith the provided configuration.false- disables batching and useSimpleSpanProcessor
You can learn more about the batching options in the Picking the right span processor page.
Sampling
When your gateway have a lot of traffic, tracing every requests can become a very expensive approach.
A mitigation for this problem is to trace only some requests, using a strategy to choose which request to trace or not.
The most common strategy is to combine both a parent first (a span is picked if parent is picked) and a ratio based on trace id (each trace, one by request, have a chance to be picked, with a given rate).
By default, all requests are traced. You can either provide you own Sampler, or provide a sampling rate which will be used to setup a Parent + TraceID Ratio strategy.
Limits
To ensure that you don’t overwhelm your tracing ingestion infrastructure, you can set limits for both cardinality and amount of data the OpenTelemetry SDK will be allowed to generate.
Configuration
Once you have an OpenTelemetry setup file, you must import it from you gateway.config.ts file. It
must be the very first import so that any other package relying on OpenTelemetry have access to the
correct configuration.
You can then enable OpenTelemetry Tracing support in the Gateway configuration.
with CLI, you can either enable OpenTelemetry tracing by using --opentelemetry option or by using
the configuration file.
OpenTelemetry Context
To correlate all observability events (like tracing, metrics, logs…), OpenTelemetry have a global and standard Context API.
This context also allows to keep the link between related spans (for parenting or linking of spans).
You can configure the behavior of the plugin with this context.
OpenTelemetry Diagnostics
If you encounter an issue with you OpenTelemetry setup, you can enable the Diagnostics API. This
will enable logging of OpenTelemetry SDK based on OTEL_LOG_LEVEL env variable.
By default, Hive Gateway configure the Diagnostics API to output logs using Hive Gateway’s logger.
You can disable this using configureDiagLogger option.
Graceful shutdown
Since spans are batched by default, it is possible to miss some traces if the batching processor is not properly flushed when the process exits.
To avoid this kind of data loss, Hive Gateway is calling forceFlush method on the registered
Tracer Provider by default. You can customize which method to call or entirely disable this behavior
by using the flushOnDispose option.
Tracer
By default, Hive Gateway will create a tracer named gateway. You can provide your own tracer if
needed.
Reported Spans
The plugin exports the following OpenTelemetry Spans:
Background Spans
Gateway Initialization
By default, the plugin will create a span from the start of the gateway process to the first schema load.
All spans happening during this time will be parented under this initialization span, including the schema loading span.
You may disable this by setting traces.spans.initialization to false:
Schema Loading
By default, the plugin will create a span covering each loading of a schema. It can be useful when polling or file watch is enabled to identify when the schema changes.
Schema loading in Hive Gateway can be lazy, which means it can be triggered as part of the handling of a request. If it happens, the schema loading span will be added as a link to the current span.
You may disable this by setting traces.spans.schema to false:
Request Spans
HTTP Request
By default, the plugin will create a root span for the HTTP layer as a span (<METHOD> /path, eg.
POST /graphql) with the following attributes:
http.method: The HTTP methodhttp.url: The HTTP URLhttp.route: The HTTP status codehttp.scheme: The HTTP schemehttp.host: The HTTP hostnet.host.name: The hostnamehttp.user_agent: The HTTP user agent (based on theUser-Agentheader)http.client_ip: The HTTP connecting IP (based on theX-Forwarded-Forheader)
And the following attributes for the HTTP response:
http.status_code: The HTTP status code
You may disable this by setting traces.spans.http to false:
Or, you may filter the spans by setting the traces.spans.http configuration to a function:
GraphQL Operation
By default, the plugin will create a span for the GraphQL layer as a span
(graphql.operation <operation name> or graphql.operation for unexecutable operations) with the
following attributes:
graphql.operation.type: The type of operation (query,mutationorsubscription).graphql.operation.name: The name of the operation to execute,Anonymousfor operations without name.graphql.document: The operation document as a GraphQL string
You may disable this by setting traces.spans.graphql to false:
Or, you may filter the spans by setting the traces.spans.graphql configuration to a function which
takes the GraphQL context as parameter:
GraphQL Parse
By default, the plugin will report the validation phase as a span (graphql.validate) with the
following attributes:
graphql.document: The GraphQL query stringgraphql.operation.name: The operation name
If a parsing error is reported, the following attribute will also be present:
graphql.error.count:1if a parse error occurred
You may disable this by setting traces.spans.graphqlParse to false:
Or, you may filter the spans by setting the traces.spans.graphqlParse configuration to a function:
GraphQL Validate
By default, the plugin will report the validation phase as a span (graphql.validate) with the
following attributes:
graphql.document: The GraphQL query stringgraphql.operation.name: The operation name
If a validation error is reported, the following attribute will also be present:
graphql.error.count: The number of validation errors
You may disable this by setting traces.spans.graphqlValidate to false:
Or, you may filter the spans by setting the traces.spans.graphqlValidate configuration to a
function:
Graphql Context Building
By default, the plugin will report the validation phase as a span (graphql.context). This span
doesn’t have any attribute.
You may disable this by setting traces.spans.graphqlContextBuilding to false:
Or, you may filter the spans by setting the traces.spans.graphqlContextBuilding configuration to a
function:
GraphQL Execute
By default, the plugin will report the execution phase as a span (graphql.execute) with the
following attributes:
graphql.document: The GraphQL query stringgraphql.operation.name: The operation name (Anonymousfor operations without name)graphql.operation.type: The operation type (query/mutation/subscription)
If an execution error is reported, the following attribute will also be present:
graphql.error.count: The number of errors in the execution result
You may disable this by setting traces.spans.graphqlExecute to false:
Or, you may filter the spans by setting the traces.spans.graphqlExecute configuration to a
function:
Subgraph Execute
By default, the plugin will report the subgraph execution phase as a client span
(subgraph.execute) with the following attributes:
graphql.document: The GraphQL query string executed to the upstreamgraphql.operation.name: The operation namegraphql.operation.type: The operation type (query/mutation/subscription)gateway.upstream.subgraph.name: The name of the upstream subgraph
You may disable this by setting traces.spans.subgraphExecute to false:
Or, you may filter the spans by setting the traces.spans.subgraphExecute configuration to a
function:
Upstream Fetch
By default, the plugin will report the upstream fetch phase as a span (http.fetch) with the
information about outgoing HTTP calls.
The following attributes are included in the span:
http.method: The HTTP methodhttp.url: The HTTP URLhttp.route: The HTTP status codehttp.scheme: The HTTP schemenet.host.name: The hostnamehttp.host: The HTTP hosthttp.request.resend_count: Number of retry attempt. Only present starting from the first retry.
And the following attributes for the HTTP response:
http.status_code: The HTTP status code
You may disable this by setting traces.spans.upstreamFetch to false:
Or, you may filter the spans by setting the traces.spans.upstreamFetch configuration to a
function:
Reported Events
The plugin exports the following OpenTelemetry Events.
Events are attached to the current span, meaning that they will be attached to your custom spans if you use them. It also means that events can be orphans if you didn’t properly setup an async compatible Context Manager
Cache Read and Write
By default, the plugin will report any cache read or write as an event. The possible event names are:
gateway.cache.miss: A cache read happened, but the key didn’t match any entitygateway.cache.hit: A cache read happened, and the key did match an entitygateway.cache.write: A new entity have been added to the cache store
All those events have the following attributes:
gateway.cache.key: The key of the cache entrygateway.cache.ttl: The ttl of the cache entry
You may disable this by setting traces.events.cache to false:
Or, you may filter the spans by setting the traces.spans.upstreamFetch configuration to a
function:
Cache Error
By default, the plugin will report any cache error as an event (gateway.cache.error). This events
have the following attributes:
gateway.cache.key: The key of the cache entrygateway.cache.ttl: The ttl of the cache entrygateway.cache.action: The type of action (readorwrite)exception.type: The type of error (thecodeif it exists, the message otherwise)exception.message: The message of the errorexception.stacktrace: The error stacktrace as a string
You may disable this by setting traces.events.cache to false:
Or, you may filter the spans by setting the traces.spans.upstreamFetch configuration to a
function:
Custom spans
Hive Gateway relies on official OpenTelemetry API, which means it is compatible with
@opentelemetry/api.
You can use any tool relying on it too, or directly use it to create your own custom spans.
To parent spans correctly, an async compatible Context Manager is highly recommended, but we also
provide an alternative if your runtime doesn’t implement AsyncLocalStorage or you want to avoid
the related performance cost.
If you are using an async compatible context manager, you can simply use the standard
@opentelemetry/api methods, as shown in
OpenTelemetry documentation.
The Gateway’s tracer is available can be accessed through the Hive Gateway OpenTelemetry API
(@graphql-hive/gateway/opentelemetry/api).
Note that the tracer will be defined only once the OpenTelemetry plugin has been instantiated,
which means it will not be defined at import time or if openTelemetry option is false.
You can also create your own tracer instead of reusing the Gateway one.
The Gateway’s tracer is available can be accessed through the Hive Gateway OpenTelemetry API
(@graphql-hive/gateway/opentelemetry/api).
Note that the tracer will be defined only once the OpenTelemetry plugin has been instantiated,
which means it will not be defined at import time or if no OpenTelemetry plugin is used.
You can also create your own tracer instead of reusing the Gateway one.
If you can’t or don’t want to use the Context Manager, Hive Gateway provides a cross platform context tracking mechanism.
To parent spans correctly, you will have to manually provide the current OTEL context. You can
retrieve the current OTEL context by either using the Hive Gateway OpenTelemetry API
(@graphql-hive/gateway/opentelemetry/api) utility function getActiveContext with a matcher. This
matcher is an object containing either the HTTP request, the GraphQL context or an
executionRequest, depending on the situation. You should always provide the most specific matcher
to get the proper context.
Custom Span Attributes, Events and Links
You can add custom attribute to Hive Gateway’s spans by using the standard @opentelemetry/api
package. You can use the same package to record custom
Events or
Links.
This can be done by getting access to the current span.
If you have an async compatible Context Manager setup, you can use the standard OpenTelemetry API to retrieve the current span as shown in OpenTelemetry documentation.
Otherwise, Hive Gateway provide it’s own cross-runtime Context tracking mechanism. In this case, you
can use
trace.getSpan standard function
to get access to the current span.
If you are using an async compatible context manager, you can simply use the standard
@opentelemetry/api methods, as shown in
OpenTelemetry documentation.
If you can’t or don’t want to use the Context Manager, Hive Gateway provides a cross platform context tracking mechanism.
You can retrieve the current OTEL context by using the Hive Gateway OpenTelemetry API
(@graphql-hive/gateway/opentelemetry/api) utility function getActiveContext with a matcher. This
matcher is an object containing either the HTTP request, the GraphQL context or an
executionRequest, depending on the situation. You should always provide the most specific matcher
to get the proper context.
When using hive.getActiveContext function, you have to make sure to provide the relevant http
request, the graphql context and the executionRequest. The context is internally stored by
referencing those objects. Missing one of the matcher can lead to unexpected parenting.
Access root spans
Sometimes, you don’t want to add the custom attribute on the current span, but on one of the root spans (http, operation, subgraph execution).
You can access those spans by using getHttpContext(request), getOperationContext(context) and
getExecutionRequestContext(executionRequest) functions from
@graphql-hive/gateway/opentelemetry/api.
They are also accessible under openTelemetry key of the graphql and configuration context, and on
the plugin. When using the graphql context, the argument is optional and functions will return the
current appropriate root context.
Setting attributes from request headers
A common need is forwarding an incoming HTTP header (a tenant id, a feature flag, a correlation id, …) as an attribute on the trace, so you can filter or group traces by it in your tracing backend.
onRequest runs before the GraphQL operation span exists, so the active span at that point is the
HTTP root span. Remember that openTelemetrySetup must have run (as the first import of your config
file) for traces: true to actually produce spans.
Use hive.getHttpContext(request) instead of trace.getActiveSpan(), as described in
Access root spans:
Setting attributes on the response
You can also add attributes once the response is known, for example the size of the payload or a
cache status header, using onResponse:
onResponse still runs within the HTTP request’s context, so the same hive.getHttpContext(request)
lookup applies:
Adding attributes from the GraphQL context
Once the operation is executing, prefer reading from the GraphQL context instead of the request,
for example to tag the trace with the authenticated user resolved by an auth plugin:
Use hive.getOperationContext(context) to retrieve the operation span instead:
Recording events and links
Events let you record something that happened during a span without creating a whole new span, and links let you relate the current span to another trace (e.g. a message queue producer/consumer relationship):
Use hive.getHttpContext(request) and hive.getExecutionRequestContext(executionRequest) to reach
the relevant spans:
Recording errors
When you catch an error yourself (instead of letting it bubble up and be reported automatically),
record it as an Exception so it shows
up consistently with the rest of the plugin’s error spans:
Troubleshooting
The default behavior of the plugin is to log errors and warnings to the console.
You can customize this behavior by changing the value of the
OTEL_LOG_LEVEL
environment variable on your gateway process/runtime.
In addition, you can use the stdout exporter to log the traces to the console:
This will log the traces to the console, which can be useful for debugging and troubleshooting.
Prometheus Metrics
Prometheus is a utility for producing, scraping and storing metrics from services and utilities.
You can use this feature of the gateway to expose and collect metrics from all phases of your GraphQL execution including internal query planning and outgoing HTTP requests.
The metrics gathered are then exposed in a format that Prometheus can scrape on a regular basis on
an HTTP endpoint (/metrics by default).
Usage Example
You can now start your Hive Gateway and make some requests to it. The plugin will start collecting
metrics, and you can access them by visiting the /metrics endpoint.
In most cases, you’ll need to setup a Prometheus server to scrape the metrics from your gateway, we recommend using the official Prometheus Server or tools like Vector.
Grafana Dashboard
If you are using Grafana to visualize your metrics, you can import this pre-configured Grafana dashboard from Grafana’s marketplace, or you can use/import this dashboard JSON file directly to easily visualize the metrics for your gateway.
For additional instructions, please refer to Import dashboards instruction in Grafana documentation.
Reported Metrics
You will find the timing of each GraphQL execution phase. If you are not familiar with the lifecycle of a GraphQL operation in the gateway, please refer to the Plugin Lifecycle page. Each plugin hook has a corresponding metric which tracks timings as histograms or summary. You will also find some counters to track the number of requests, errors, and other useful information.
To enable a metric, set the corresponding option to true in the metrics option’s object. You can
also provide a string to customize the metric name, or an object to provide more options (see
siimon/prom-client documentation).
Histogram metrics can be passed an array of numbers to configure buckets.
graphql_yoga_http_duration (default: enabled, type: Histogram)
This metric tracks the duration of incoming (downstream) HTTP requests. It reports the time spent to process each incoming request as a histogram.
It is useful to track the responsiveness of your gateway. A spike in this metric could indicate a performance issue and that further investigation is needed.
Please note that this metric is not specific to GraphQL, it tracks all incoming HTTP requests.
You can use labels to have a better understanding of the requests and group them together. A common
filter is to include only statusCode with 200 value and method with POST (the default method
for GraphQL requests, but it can also be GET depending on your client setup) value to get
execution time of successful GraphQL requests only.
This metric includes some useful labels to help you identify requests and group them together.
| Label | Description |
|---|---|
method | The HTTP method used to request the gateway endpoint. Since GraphQL usually only uses POST requests, this can be used to filter out GraphiQL-related requests. It can be any HTTP verb, including disallowed ones. Which means this metric can also be used to track malformed or malicious requests. |
statusCode | The HTTP status code returned by the gateway. You probably want to filter out non- 200 responses to have a view of the successful requests.This can help you identify which requests are failing and why. Since GraphQL errors are returned as 200 OK responses, this can be useful to track errors that are not related to the GraphQL, like malformed requests. |
operationName | If available, the name of the GraphQL operation requested, otherwise Anonymous.This can help you identify which operations are slow or failing. We recommend you always provide an operation name to your queries and mutations to help performance analysis and bug tracking. |
operationType | The type of the GraphQL operation requested. It can be one of query, mutation, or subscription.This can help you differentiate read and write performance of the system. It can for example help understand cache impact. |
url | The URL of the request. Useful to filter graphql endpoint metrics (/graphql by default). |
graphql_gateway_fetch_duration (default: enabled, type: Histogram)
This metric tracks the duration of outgoing HTTP requests. It reports the time spent on each request
made using the fetch function provided by the gateway. It is reported as a
histogram.
This metric can provide insights into the network usage of your gateway. It does not only include requests made to resolve GraphQL operation responses, but also include any other outgoing HTTP requests made by the gateway or one of its plugins. It will for example include requests made to fetch the supergraph schema from the configured Schema Registry.
These metrics include some useful labels to help you identify requests and group them together.
Since they can be heavy, requestHeaders and responseHeaders are disabled by default. You can
either set those options to true in the label configuration object to include all headers in the
label, but you can also provide a list of header names to include.
| Label | Description |
|---|---|
url | The URL of the upstream request. |
method | The HTTP method of the upstream request. |
statusCode | The status code of the upstream response. |
statusText | The status text of the upstream response. |
requestHeaders | Disabled by default. A JSON encoded object containing the headers of the upstream request. |
responseHeaders | Disabled by default. A JSON encoded object containing the headers of the upstream response. |
graphql_gateway_subgraph_execute_duration (default: enabled, type: Histogram)
This metric tracks the duration of subgraph execution. It reports the time spent on each subgraph queries made to resolve incoming operations as a histogram.
This metric can provide insights into how the time is spent to resolve queries. It can help you identify bottlenecks in your subgraphs.
| Label | Description |
|---|---|
subgraphName | The name of the targeted subgraph. |
operationType | The type of the GraphQL operation executed by the subgraph. This can be one of query, mutation, or subscription. |
operationName | The name of the GraphQL operation executed by the subgraph. It will be Anonymous if no operationName is found. |
graphql_gateway_subgraph_execute_errors (default: enabled, type: Counter)
This metric tracks the number of errors that occurred during the subgraph execution. It counts all errors found in the response returned by the subgraph execution. It is exposed as a counter.
This metric can help you identify subgraphs that are failing to execute operations. It can help identify issues with the subgraph itself or the communication between the gateway and the subgraph.
| Label | Description |
|---|---|
subgraphName | The name of the targeted subgraph. |
operationType | The type of the GraphQL operation executed by the subgraph. This can be one of query, mutation, or subscription. |
operationName | The name of the GraphQL operation executed by the subgraph. It will be Anonymous if no operationName is found. |
graphql_envelop_phase_parse (default: enabled, type: Histogram)
This metric tracks the duration of the parse phase of the GraphQL execution. It reports the time
spent parsing the incoming GraphQL operation. It is reported as a
histogram.
Since you don’t have control over the parsing phase, this metric is mostly useful to track potential attacks. A spike in this metric could indicate someone is trying to send malicious operations to your gateway.
| Label | Description |
|---|---|
operationType | The type of the GraphQL operation requested. This can be one of query, mutation, or subscription. |
operationName | The name of the GraphQL operation requested. It will be Anonymous if no operationName is found. |
graphql_envelop_phase_validate (default: enabled, type: Histogram)
This metric tracks the duration of the validate phase of the GraphQL execution. It reports the
time spent validating the incoming GraphQL operation. It is reported as a
histogram.
| Label | Description |
|---|---|
operationType | The type of the GraphQL operation requested. This can be one of query, mutation, or subscription. |
operationName | The name of the GraphQL operation requested. It will be Anonymous if no operationName is found. |
graphql_envelop_phase_context (default: enabled, type: Histogram)
This metric tracks the duration of the context phase of the GraphQL execution. It reports the time
spent building the context object that will be passed to the executors. It is reported as a
histogram.
| Label | Description |
|---|---|
operationType | The type of the GraphQL operation requested. This can be one of query, mutation, or subscription. |
operationName | The name of the GraphQL operation requested. It will be Anonymous if no operationName is found. |
graphql_envelop_phase_execute (default: enabled, type: Histogram)
This metric tracks the duration of the execute phase of the GraphQL execution. It reports the time
spent actually resolving the response of the incoming operation. This includes the gathering of all
the data from all sources required to construct the final response. It is reported as a
histogram.
It is the metric that will give you the most insights into the performance of your gateway, since this is where most of the work is done.
| Label | Description |
|---|---|
operationType | The type of the GraphQL operation requested. This can be one of query, mutation, or subscription. |
operationName | The name of the GraphQL operation requested. It will be Anonymous if no operationName is found. |
graphql_envelop_phase_subscribe (default: enabled, type: Histogram)
This metric tracks the duration of the subscribe phase of the GraphQL execution. It reports the
time spent initiating a subscription (which doesn’t include actually sending the first response). It
is reported as a histogram.
It will notably include the time spent to setup upstream subscriptions with appropriate transport for each source.
| Label | Description |
|---|---|
operationType | The type of the GraphQL operation requested. This can be one of query, mutation, or subscription. |
operationName | The name of the GraphQL operation requested. It will be Anonymous if no operationName is found. |
graphql_envelop_request_duration (default: enabled, type: Histogram)
This metric tracks the duration of the complete GraphQL operation execution. It reports the time spent in the GraphQL specific processing, excluding the HTTP-level processing. It is reported as a histogram.
| Label | Description |
|---|---|
operationType | The type of the GraphQL operation requested. This can be one of query, mutation, or subscription. |
operationName | The name of the GraphQL operation requested. It will be Anonymous if no operationName is found. |
graphql_envelop_request_time_summary (default: enabled, type: Summary)
This metric provides a summary of the time spent on the GraphQL operation execution. It reports the
same timing than graphql_envelop_request_duration but as a
summary.
| Label | Description |
|---|---|
operationType | The type of the GraphQL operation requested. This can be one of query, mutation, or subscription. |
operationName | The name of the GraphQL operation requested. It will be Anonymous if no operationName is found. |
graphql_envelop_error_result (default: enabled, type: Counter)
This metric tracks the number of errors that was returned by the GraphQL execution.
Similarly to graphql_gateway_subgraph_execute_errors,
it counts all errors found in the final response constructed by the gateway after it gathered all
subgraph responses, but it also includes errors from other GraphQL processing phases (parsing,
validation and context building). It is exposed as a
counter.
Depending on the phase when the error occurred, some labels may be missing. For example, if the
error occurred during the context phase, only the phase label will be present.
| Label | Description |
|---|---|
path | The path of the field that caused the error. It can be undefined if the error is not related to a given field. |
phase | The phase of the GraphQL execution where the error occurred. It can be parse, validate, context, execute (for every operation types including subscriptions). |
operationType | The type of the GraphQL operation requested. This can be one of query, mutation, or subscription. |
operationName | The name of the GraphQL operation requested. It will be Anonymous if no operationName is found. |
graphql_envelop_request (default: enabled, type: Counter)
This metric tracks the number of GraphQL operations executed. It counts all operations, either failed or successful, including subscriptions. It is exposed as a counter.
It can differ from the number reported by
graphql_yoga_http_duration_sum because a single HTTP request can
contain multiple GraphQL operations if batching has been enabled.
| Label | Description |
|---|---|
operationType | The type of the GraphQL operation requested. This can be one of query, mutation, or subscription. |
operationName | The name of the GraphQL operation requested. It will be Anonymous if no operationName is found. |
graphql_envelop_deprecated_field (default: enabled, type: Counter)
This metric tracks the number of deprecated fields used in the GraphQL operation.
| Label | Description |
|---|---|
fieldName | The name of the deprecated field that has been used. |
typeName | The name of the parent type of the deprecated field that has been used. |
operationType | The type of the GraphQL operation requested. This can be one of query, mutation, or subscription. |
operationName | The name of the GraphQL operation requested. It will be Anonymous if no operationName is found. |
graphql_envelop_schema_change (default: enabled, type: Counter)
This metric tracks the number of schema changes that have occurred since the gateway started. When polling is enabled, this will include the schema reloads.
If you are using a plugin that modifies the schema on the fly, be aware that this metric will also include updates made by those plugins. Which means that one schema update can actually trigger multiple schema changes.
graphql_envelop_execute_resolver (default: disabled, type: Histogram)
This metric tracks the duration of each resolver execution. It reports the time spent only on additional resolvers, not on fields that are resolved by a subgraph. It is up to the subgraph server to implement resolver level metrics, the gateway can’t remotely track their execution time.
| Label | Description |
|---|---|
operationType | The type of the GraphQL operation requested. This can be one of query, mutation, or subscription. |
operationName | The name of the GraphQL operation requested. It will be Anonymous if no operationName is found. |
fieldName | The name of the field being resolved. |
typeName | The name of the parent type of the field being resolved. |
returnType | The name of the return type of the field being resolved. |
Filter resolvers to instrument
To mitigate the cost of instrumenting all resolvers, you can explicitly list the fields that should
be instrumented by providing a list of field names to the instrumentResolvers option.
It is a list of strings in the form of TypeName.fieldName. For example, to instrument the hello
root query, you would use Query.hello.
You can also use wildcards to instrument all the fields for a type. For example, to instrument all
root queries, you would use Query.*.
Troubleshooting
You can observe and troubleshoot the metrics by visiting the /metrics endpoint of your gateway.
Run your gateway and execute a few GraphQL operations to produce some metrics.
Then, use the following curl command will fetch the metrics from your gateway:
Customizations
By default, all operations are instrumented, including introspection queries. It is possible to
ignore introspection queries for all metrics prefixed by graphql_envelop_ by setting the
skipIntrospection option to true.
By default, all labels are enabled, but each one can be disabled to reduce cardinality:
By providing a string, you can change the name of the metric. For example, to change the name of the
name of the graphql_yoga_http_duration metric to http_request_duration, you would use:
By providing an object, you can customize the metric configuration. These configuration objects
should be created using the provided factories for each metric type (createCounter,
createHistogram, createSummary).
Available options depend on the metric type, and full details about them can be found in the
siimon/prom-client documentation.
For example, you can customize the buckets of the graphql_yoga_http_duration histogram metric:
You can customize the client’s registry by passing a custom registry to the registry option.
In some cases, the large variety of label values can lead to a huge amount of metrics being exported. To save bandwidth or storage, you can reduce the amount of reported metrics by multiple ways.
Monitor only some phases
Some metrics observe events in multiple phases of the graphql pipeline. The metric with the highest
chance causing large amount of metrics is graphql_envelop_error_result, because it can contain
information specific to the error reported.
You can lower the amount of reported errors by changing the phases monitored by this metric.
Skip observation based on request context
To save bandwidth or storage, you can reduce the amount of reported values by filtering which events are observed based on the request context.
For example, you can only monitor a subset of operations, because they are critical or that you want to debug it’s performance:
StatsD
You can use @graphql-mesh/plugin-statsd plugin to collect and send metrics to Datadog’s DogStatsD
and InfluxDB’s Telegraf StatsD services.
Compatible with:
- Datadog’s DogStatsD server
- InfluxDB’s Telegraf StatsD server
- Etsy’s StatsD serve
Available metrics:
graphql.operations.count- the number of performed operations (including failures)graphql.operations.error.count- the number of failed operationsgraphql.operations.latency- a histogram of response times (in milliseconds)graphql.delegations.count- the number of delegated operations to the sourcesgraphql.delegations.error.count- the number of failed delegated operationsgraphql.delegations.latency- a histogram of delegated response times (in milliseconds)graphql.fetch.count- the number of outgoing HTTP requestsgraphql.fetch.error.count- the number of failed outgoing HTTP requestsgraphql.fetch.latency- a histogram of outgoing HTTP response times (in milliseconds)
Usage Example
Sentry
This plugin collects errors and performance tracing for your execution flow, and reports it to Sentry.
This is how it looks like in Sentry for error tracking:
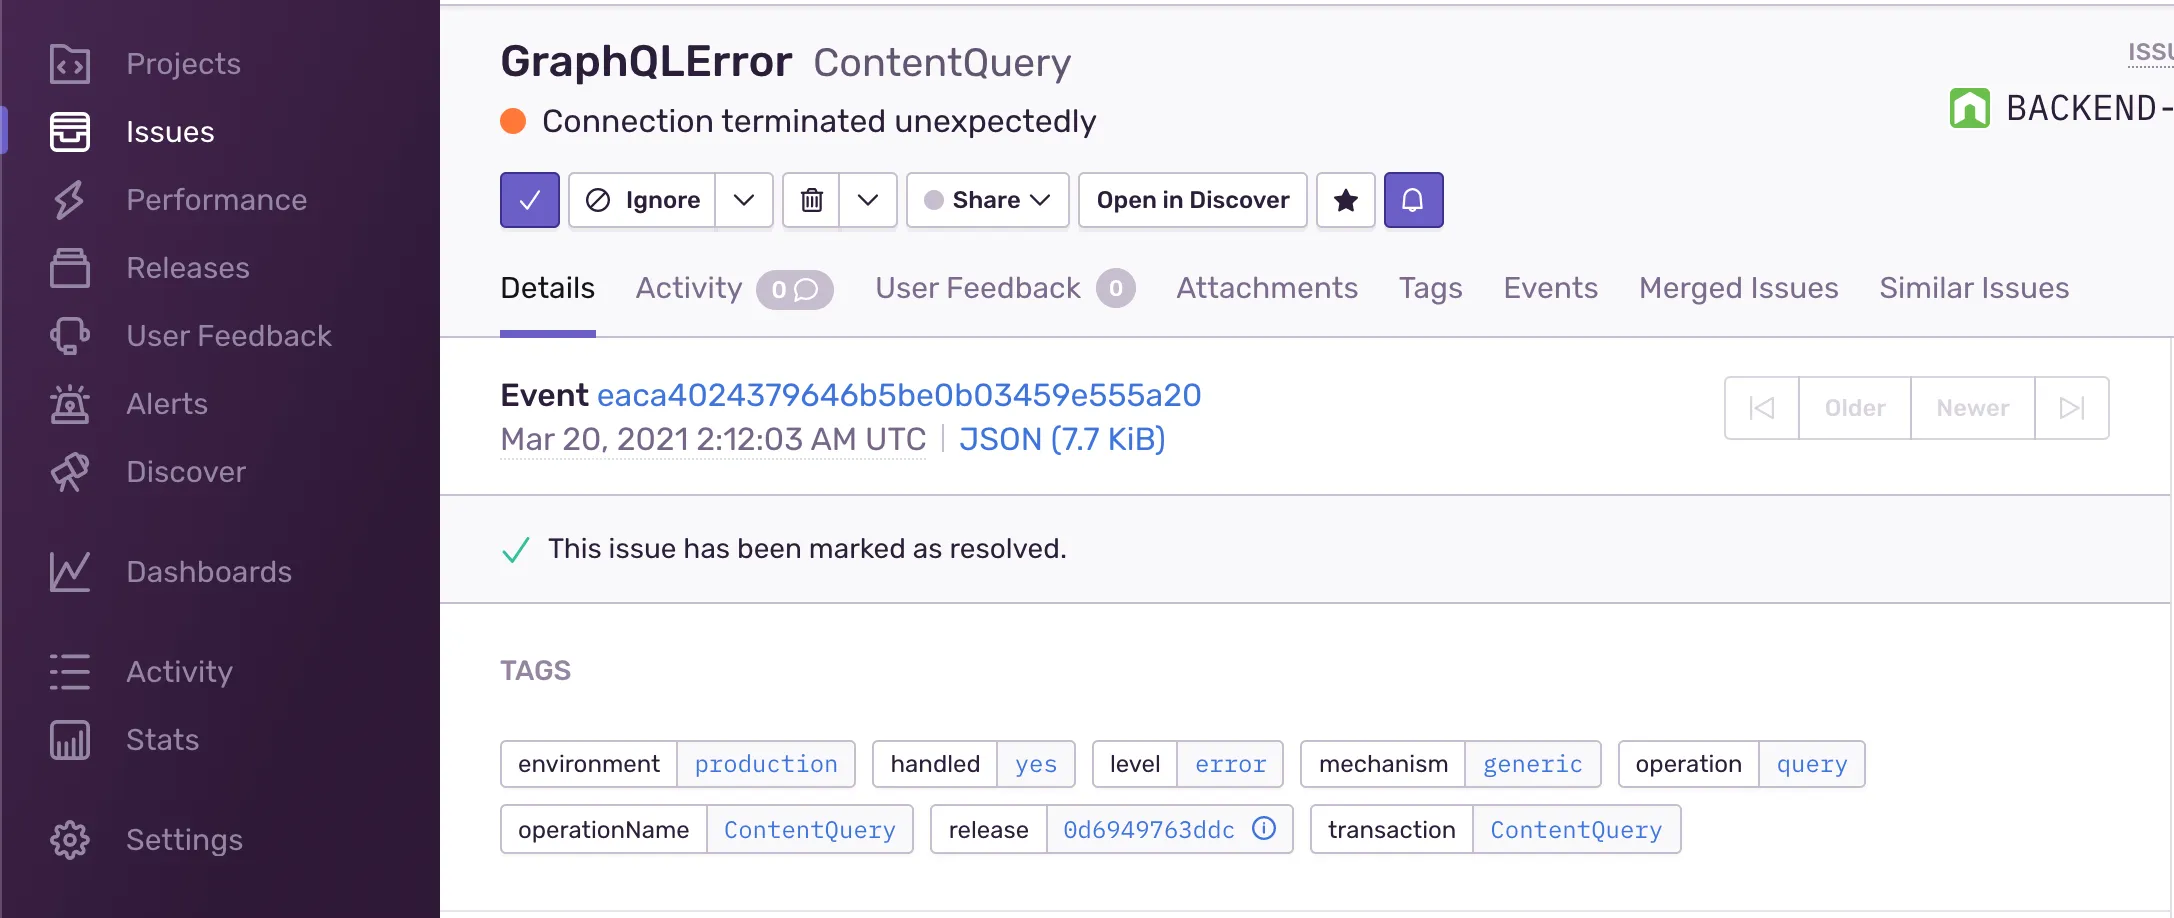
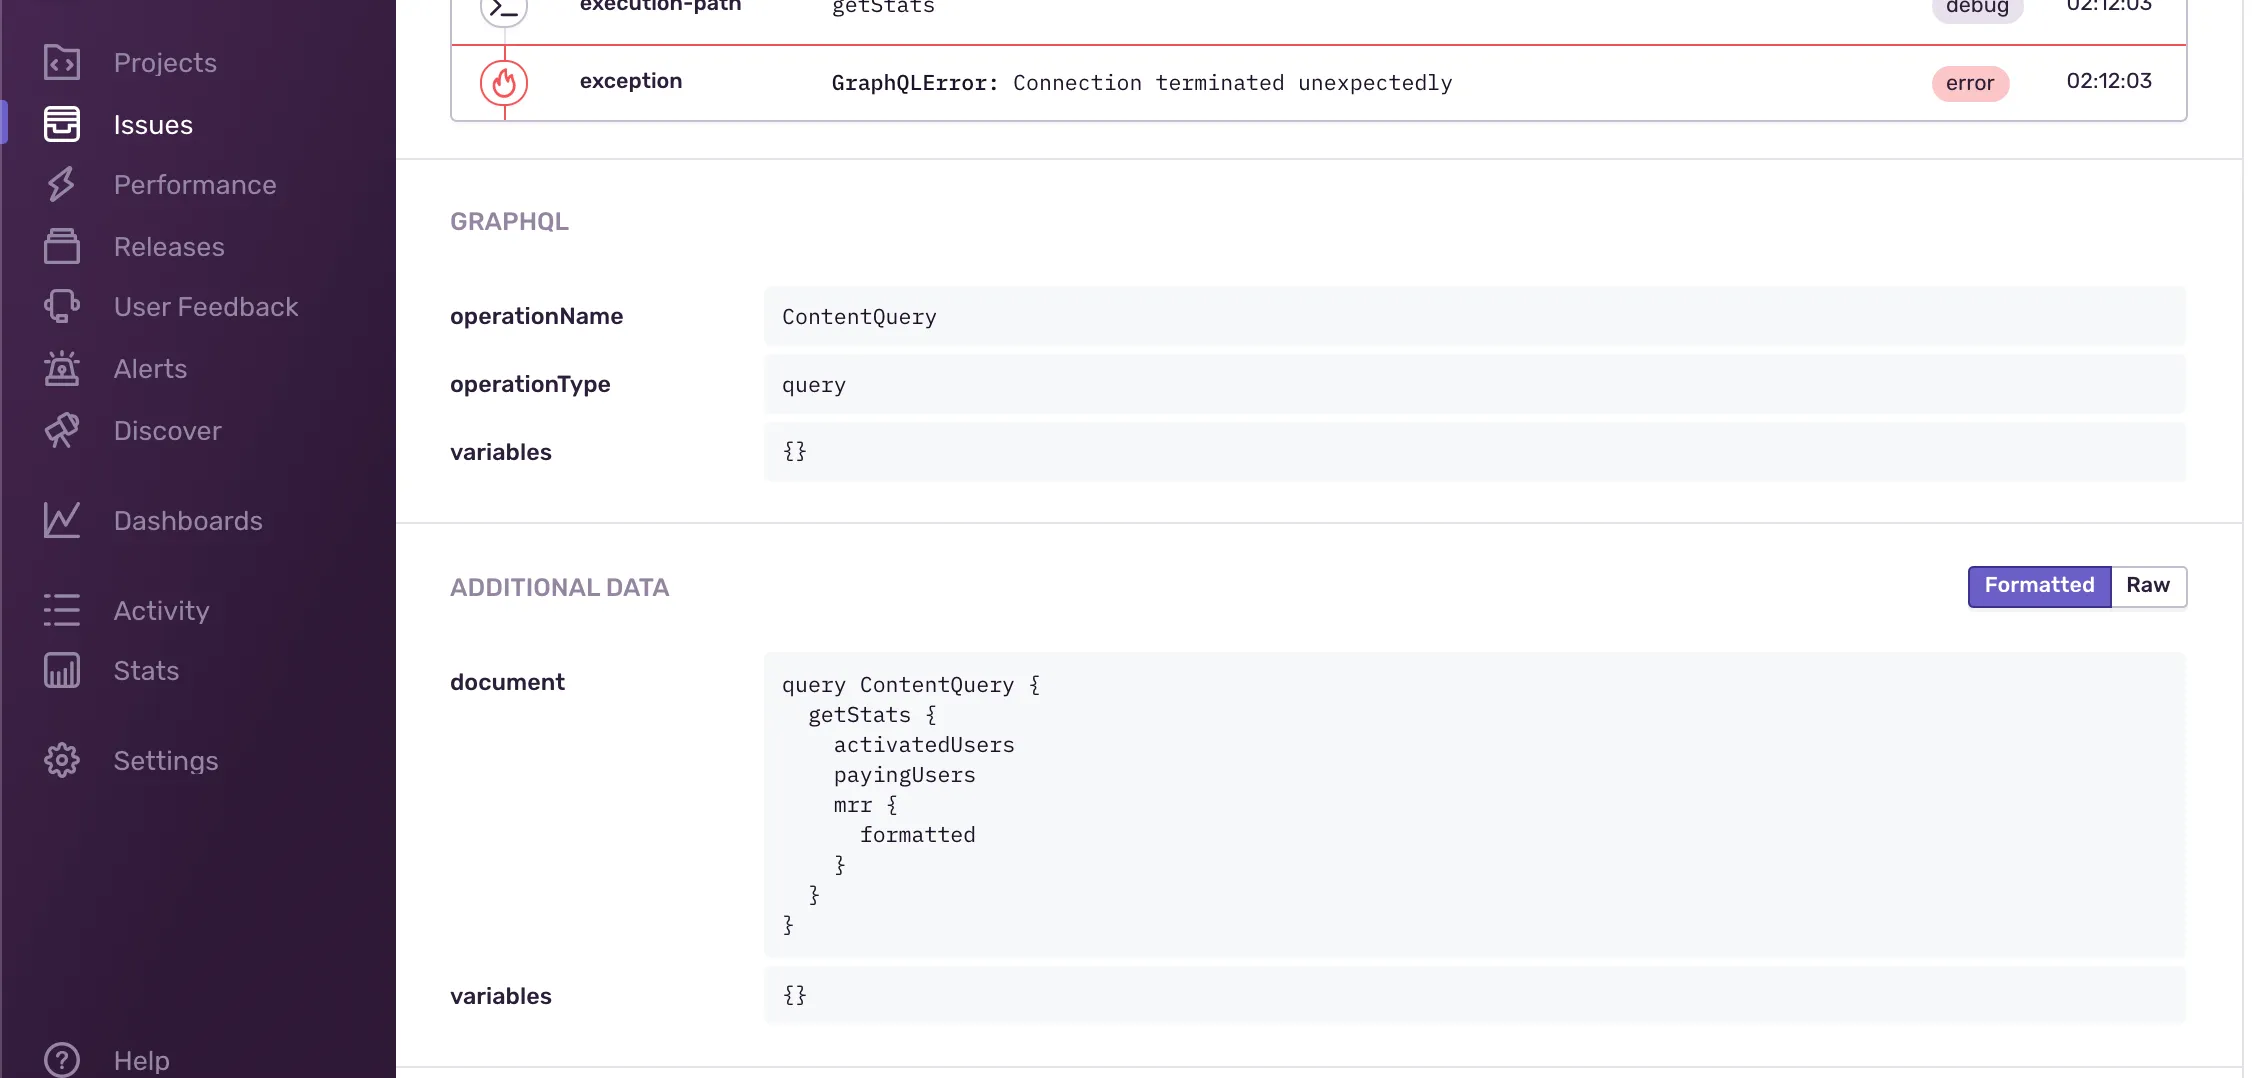
To get started with Sentry, you need to create a new project in Sentry and get the DSN:
- Start by creating an account and a project in https://sentry.io
- Follow the instructions to setup your Sentry instance in your application.
- Setup Sentry global instance configuration.
- Setup the Envelop plugin.
Then, install the following plugin in your project:
Usage Example
Configuration
startTransaction(default:true) - Starts a new transaction for every GraphQL Operation. When disabled, an already existing Transaction will be used.renameTransaction(default:false) - Renames Transaction.includeRawResult(default:false) - Adds result of each resolver and operation to Span’s data (available under “result”)includeExecuteVariables(default:false) - Adds operation’s variables to a Scope (only in case of errors)appendTags- See example above. Allow you to manipulate the tags reports on the Sentry transaction.configureScope- See example above. Allow you to manipulate the tags reports on the Sentry transaction.transactionName(default: operation name) - Produces a name of Transaction (only when “renameTransaction” or “startTransaction” are enabled) and description of created Span.traceparentData(default:{}) - Adds tracing data to be sent to Sentry - this includes traceId, parentId and more.operationName- Produces a “op” (operation) of created Span.skip(default: none) - Produces a “op” (operation) of created Span.skipError(default: ignoredGraphQLError) - Indicates whether or not to skip Sentry exception reporting for a given error. By default, this plugin skips allGraphQLErrorerrors and does not report it to Sentry.eventIdKey(default:'sentryEventId') - The key in the error’s extensions field used to expose the generated Sentry event id. Set tonullto disable.